
Cash Conversion Cycle: how long cash is actually stuck in the business
What the cash conversion cycle means
The last three posts each measured one leg of the same journey: how long stock sits before it sells (Inventory Days), how long customers take to pay (Debtor Days), and how long the company itself takes to pay its suppliers (Creditor Days). The Cash Conversion Cycle (CCC) stitches all three together into one number: how many days does cash stay tied up in the operating cycle — from paying for raw material, to holding inventory, to collecting from customers — before it’s back in the company’s hands?
The formula
CCC = Inventory Days + Debtor Days − Creditor Days
Inventory days and debtor days both represent cash going out and staying out; creditor days represents cash the company gets to hold onto for a while before it has to pay it out. That’s why it’s subtracted — every day of creditor days is a day of financing the company gets from its suppliers instead of needing its own cash.
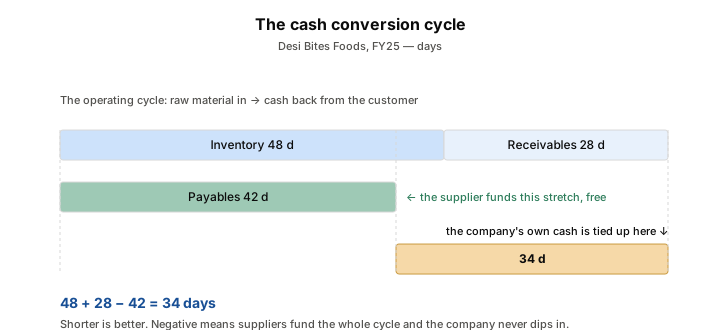
Desi Bites Foods, FY25 — the fictional case study, drawn to scale from the same figures used in the tables below. Illustration only.
Worked example: Desi Bites Foods, FY25
| Days | |
|---|---|
| Inventory Days | 48 |
| + Debtor Days | 28 |
| − Creditor Days | 42 |
| Cash Conversion Cycle | 34 days |
Desi Bites’ cash is tied up for 34 days between paying for raw material and getting paid by distributors — a perfectly normal cycle for a small manufacturer.
Worked example: Britannia Industries, FY25
Same three components, computed from Britannia Industries’ audited consolidated FY25 results (year ended 31 March 2025, filed 8 May 2025), each covered in the last three posts. For illustration only.
| Days | |
|---|---|
| Inventory Days | 42.6 |
| + Debtor Days | 9.1 |
| − Creditor Days | 60.3 |
| Cash Conversion Cycle | -8.6 days |
That’s a negative cash conversion cycle. Britannia collects from customers and sells through inventory faster than it pays its own suppliers — meaning, on average, the company is holding onto its suppliers’ money even after it has already turned that stock into cash from a customer. It is effectively financed by its supply chain rather than the other way around. This isn’t an accounting trick; it’s what genuine scale and brand bargaining power in FMCG looks like in the numbers, and it’s a pattern you’ll see repeated at other large, well-established consumer companies.
🧒 Explain it like I'm 10 (optional — skip if this is already clear)
Imagine a relay race where the baton is cash. Leg one: cash turns into stock. Leg two: stock turns into a sale (but the customer hasn’t paid yet). Leg three: the customer finally pays, and cash is back. Meanwhile, a separate runner — your supplier — is chasing you the whole time, waiting to be paid. The cash conversion cycle measures how big a head start you have on that supplier-runner. Most of the time you’re a little ahead of them. Britannia’s number means it’s so far ahead that the supplier-runner actually finishes after you’ve already completed the whole lap.
Common mistakes
- Assuming a negative CCC is something any company can simply choose to have. It’s usually the result of real bargaining power built over years of scale and brand strength — not a lever a company can pull on demand. Attempting to force it (by squeezing suppliers too hard) can damage those relationships instead.
- Comparing CCC across industries. A retailer, a manufacturer, and a services company have structurally different operating cycles — CCC is most meaningful compared within an industry or against the same company’s own history.
- Missing how CCC can be artificially flattered. Techniques like reverse factoring (where a bank effectively pays the supplier early, but the company’s payable still shows as outstanding) can stretch reported creditor days without reflecting a genuine operating advantage — worth a glance at the notes to accounts for a company with a surprisingly low or negative CCC.
- Reading a single year’s CCC without checking the trend. A rising CCC over several years — cash getting more, not less, tied up — is a more useful signal than one year’s number in isolation.
Takeaway: the cash conversion cycle measures how many days a company’s cash is tied up in its own operating cycle before coming back — a negative number, like Britannia’s here, means the company is effectively financed by its own supply chain, a real structural advantage rather than an accounting curiosity.
This post is for educational purposes only and is not investment advice. Wealth Primer explains concepts, not recommendations — nothing here is a suggestion to buy, sell, or hold any specific security or fund. The author is not a SEBI-registered Research Analyst or Investment Adviser. Any prices or figures used as worked examples are historical and shown only to illustrate a calculation. Past performance does not indicate future results. Please do your own research or consult a registered adviser before making investment decisions. See the privacy & disclaimer policy for more.